
Infographic Maker
Most infographics fail because they try to say too much. This maker keeps to a proven structure — a clear headline, three big numbers, one simple chart, a short sequence of steps and a source line — and lays it out cleanly in your colours. Type your content, check the preview and download a PNG for social media or an SVG for further editing.
- Free to use
- No sign-up
- Runs in your browser
Infographic maker
Infographic Planning Pack
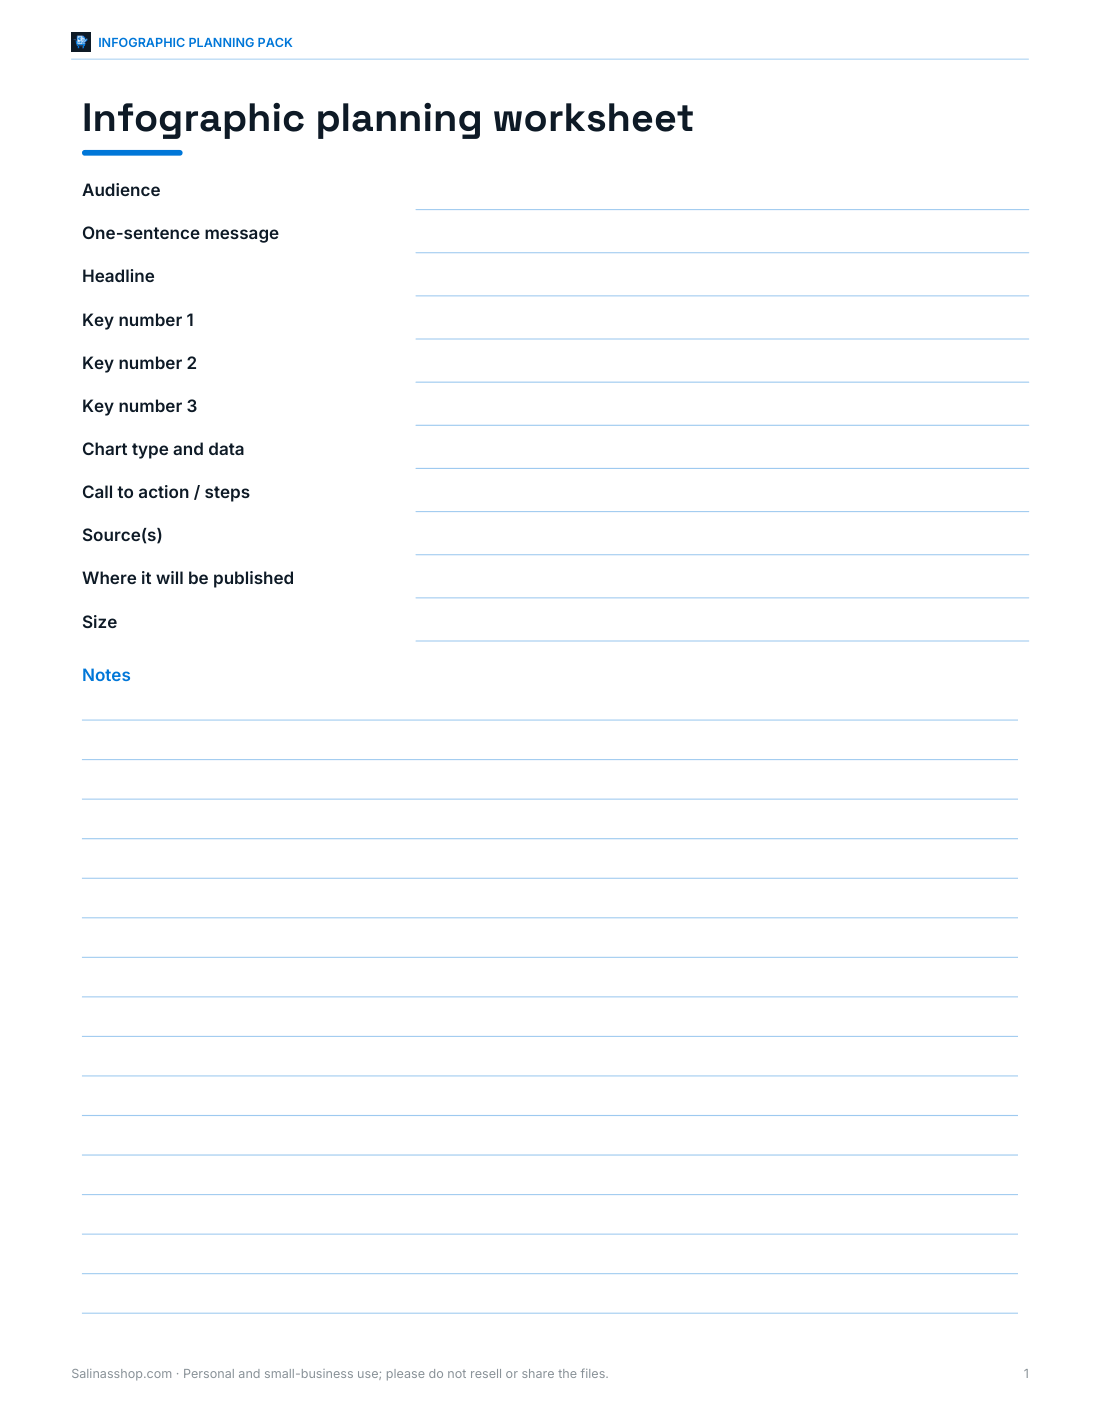
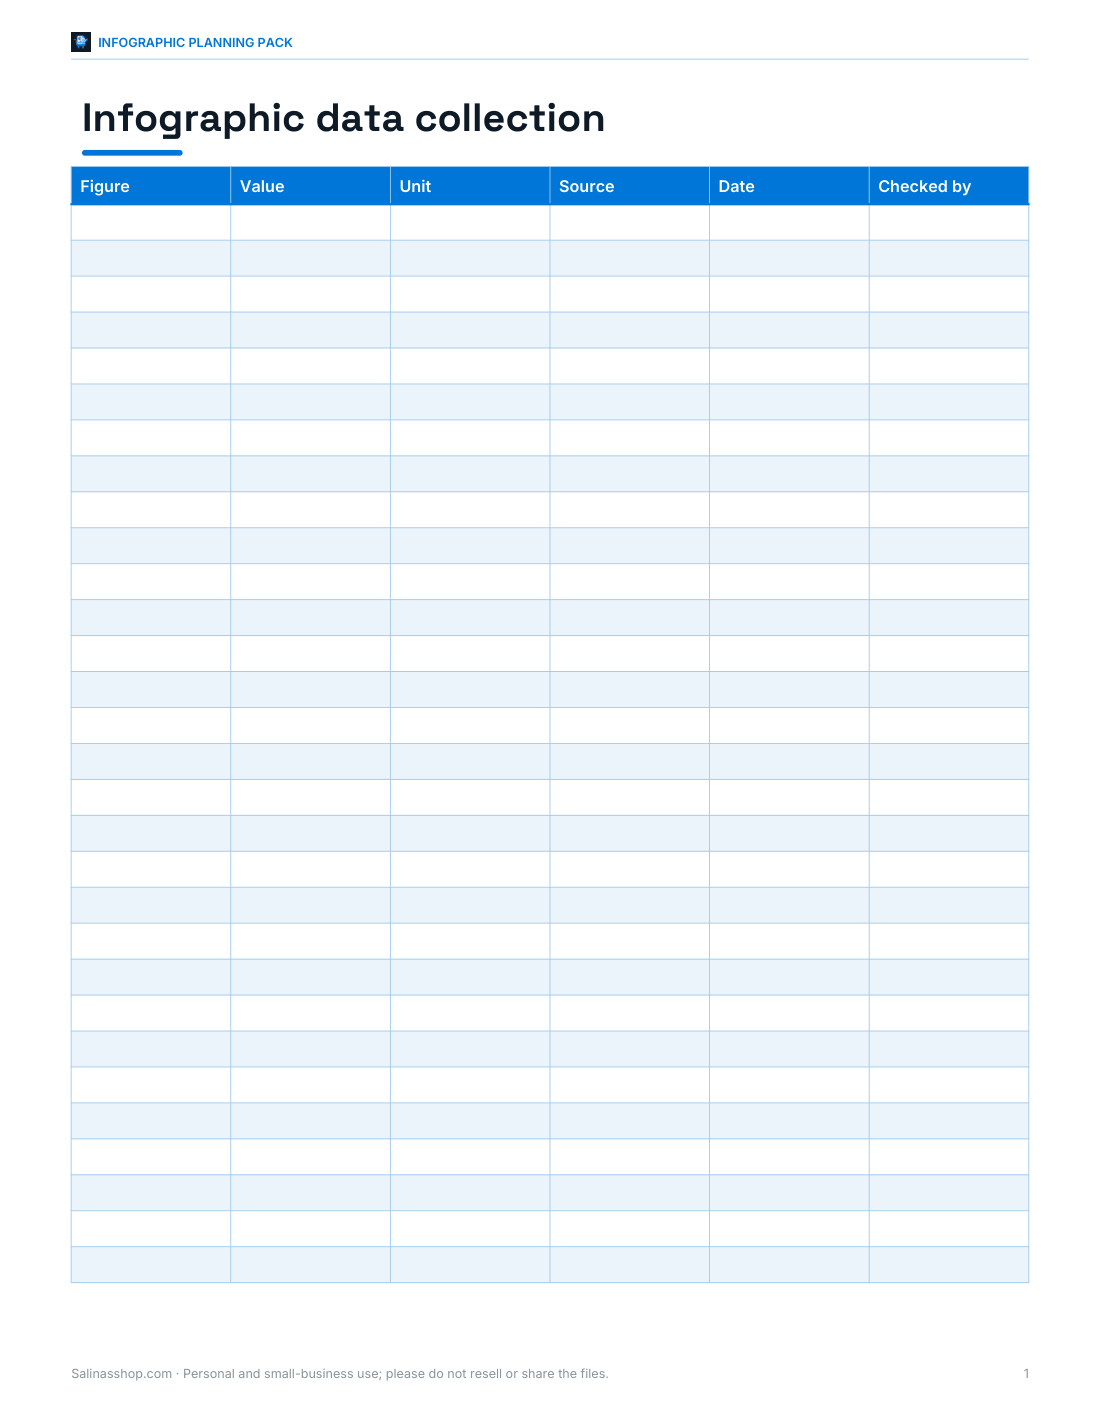
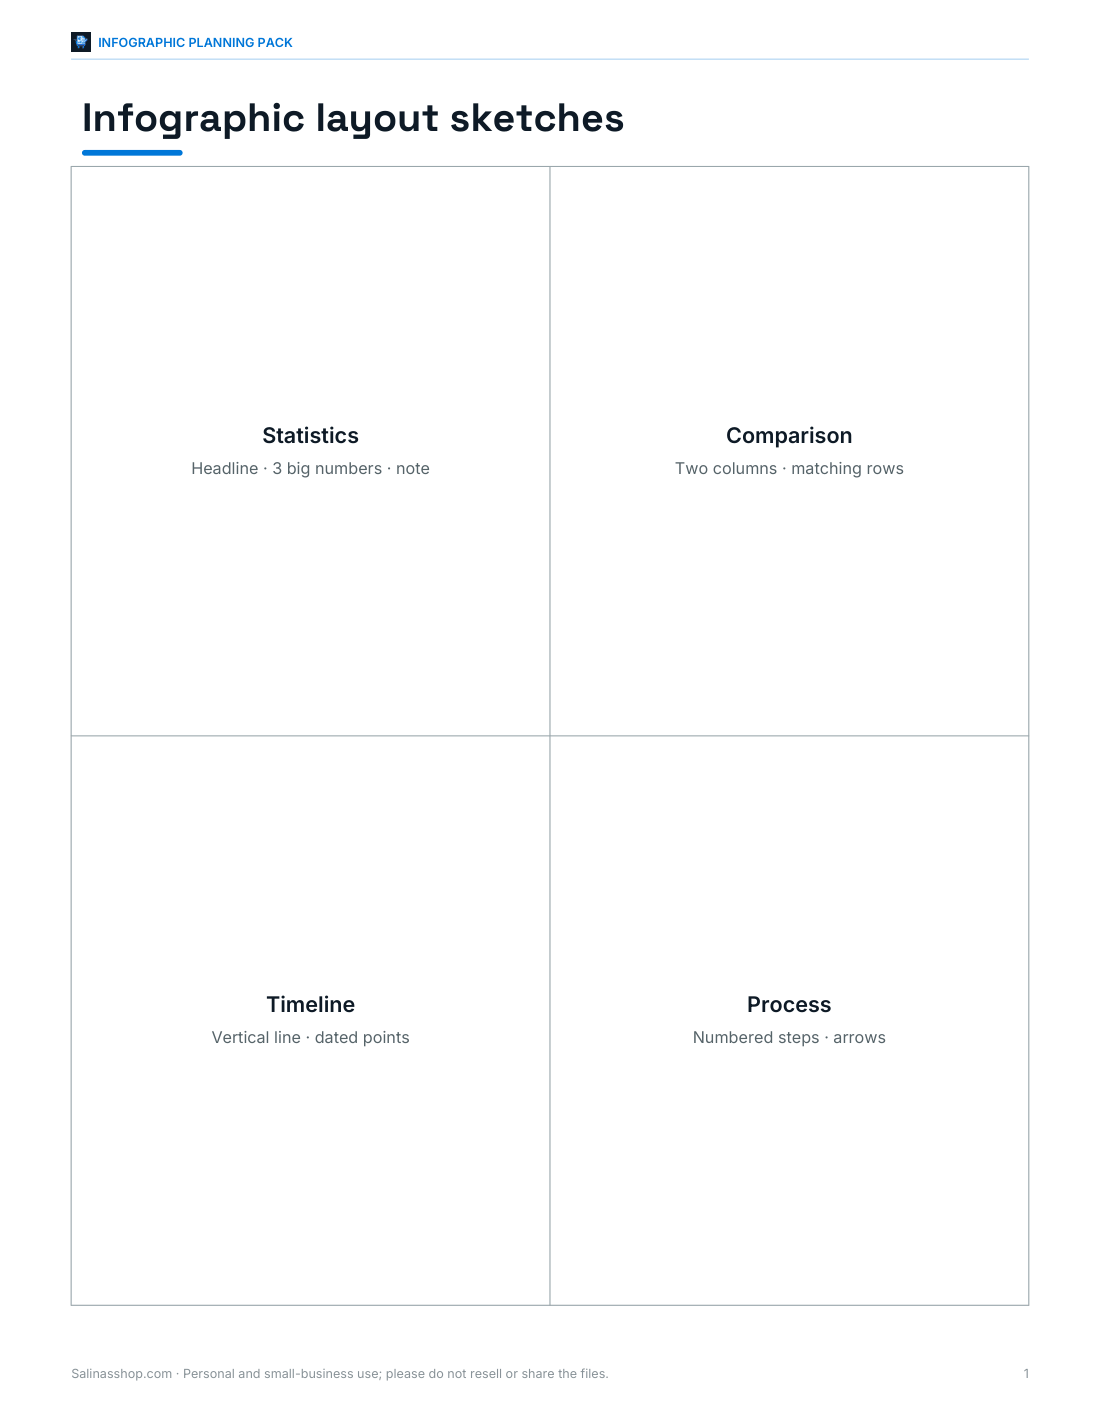
Infographic planning worksheet, data collection sheet, ten layout sketch templates, an accessible colour palette card and a publishing checklist.
- Planning worksheet (PDF/DOCX)
- Data sheet (PDF/DOCX/XLSX)
- Layout sketches (PDF)
- Palette card (PDF)
- Publishing checklist (PDF/DOCX)
Formats: PDF, DOCX, XLSX. Instant download after payment (link valid 72 hours, up to 5 downloads). AI-assisted: the templates were drafted with AI help and reviewed and laid out before publishing.
$5.00 USD, one-time 5 files · about $1.00 each
- Instant download
- 7-day refund
- Secure checkout by Stripe
7-day money-back guarantee. Full refund within 7 days of purchase, even after you download.
Free sample: Infographic Planning Worksheet (PDF, 50 KB)
Full refund within 7 days — see the refund policy and license.
Free printables
Single sheets you can print right now, no sign-up. The full pack adds every sheet in one download plus the editable files.
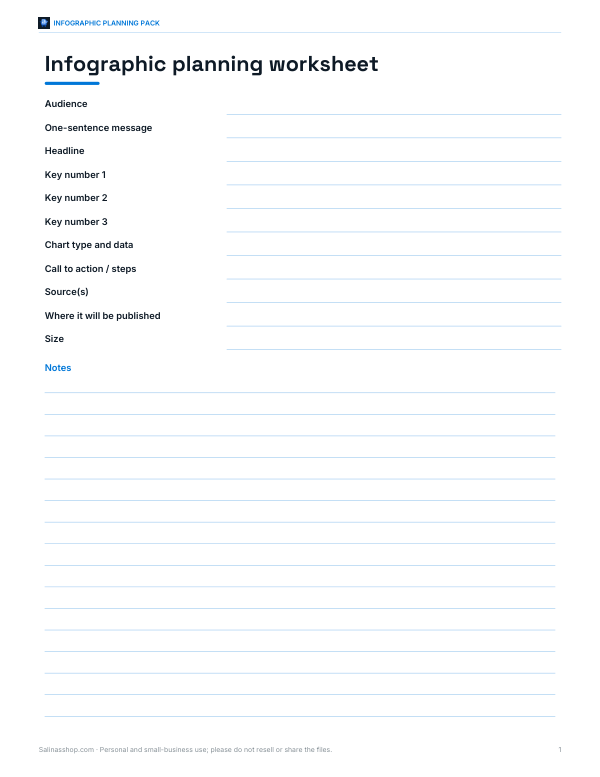 Printable Infographic Planning Worksheet
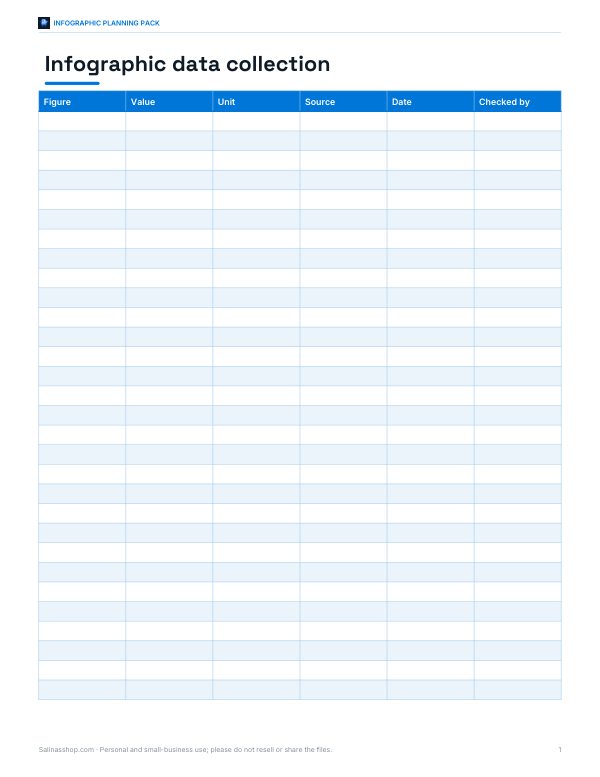 Printable Infographic Data Sheet
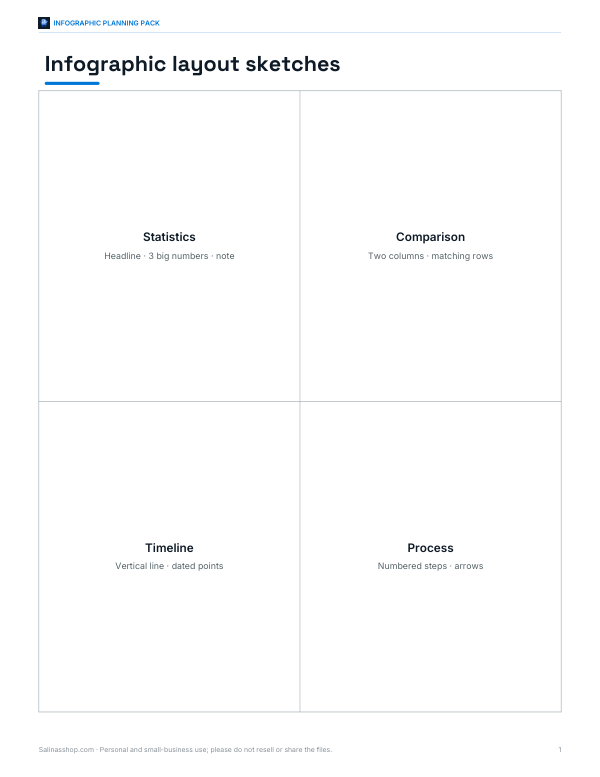 Printable Infographic Layout Sketches
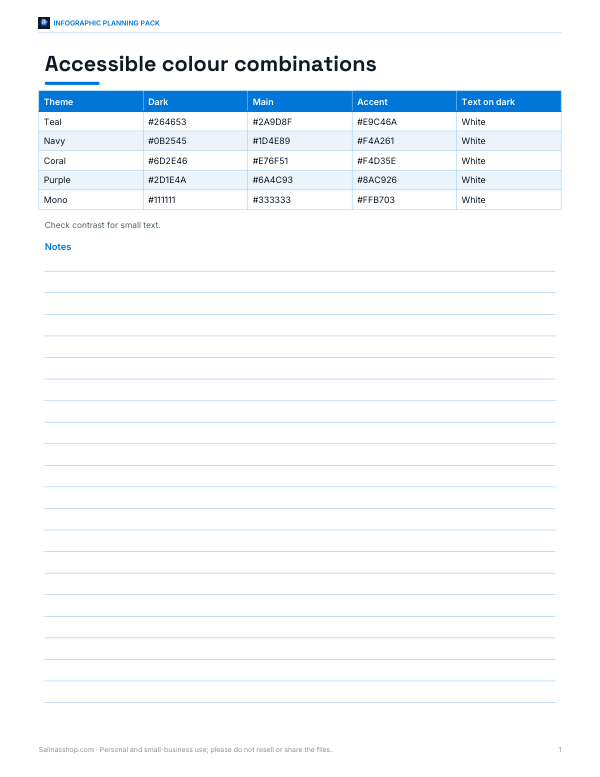 Printable Palette Card
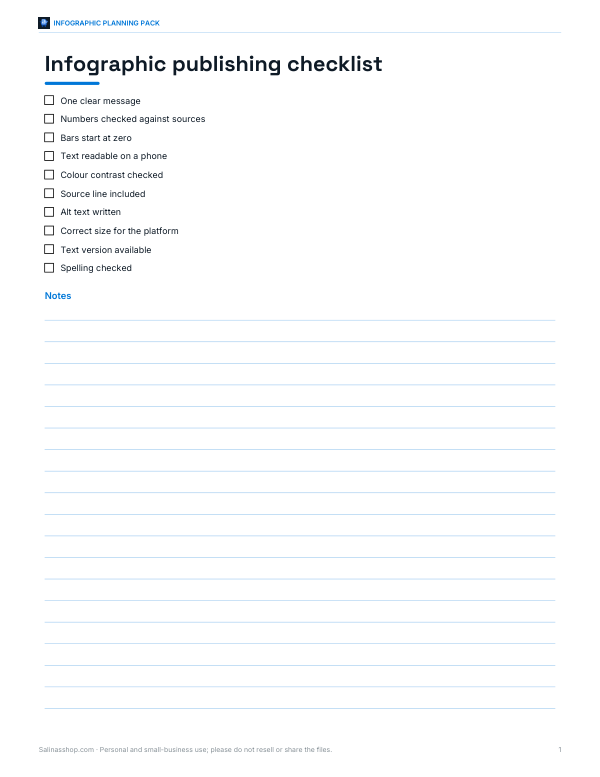 Printable Infographic Publishing Checklist
What makes an infographic work
- One message: the headline should say what the reader will learn.
- A few numbers that matter, shown big — three is usually enough.
- One simple chart rather than several complicated ones.
- A clear reading order, top to bottom.
- Plenty of white space and a limited colour palette.
- A source line, so readers can trust and check the data.
The maker follows this structure deliberately. If your content doesn’t fit it, you may need two infographics rather than one crowded one.
Choosing the right chart
| Data | Chart | Why |
|---|---|---|
| Comparing amounts across categories | Horizontal bar chart (used here) | Labels are easy to read; lengths are easy to compare |
| Parts of a whole | Bar chart or a single stacked bar | Pie charts are hard to read beyond three or four slices |
| Change over time | Line or column chart | Shows trend direction |
| A single important figure | Big number | Most memorable |
| Process or sequence | Numbered steps | Shows order clearly |
Bars in this maker start at zero, as bar charts should — truncated axes exaggerate differences. The largest value is highlighted in the accent colour to draw the eye.
Sizes for sharing
| Where | Suggested width | Notes |
|---|---|---|
| Website or blog | 800 px | Readable in an article column |
| 1000 px wide, tall format | Tall pins show well in feeds | |
| Instagram / LinkedIn | 1080 px wide | Tall images may be cropped in feeds — consider splitting into a carousel |
| Use the SVG | Scales without blurring |
Worked example
A town council wants to share recycling results. The headline “How Our Town Recycles” sits in the dark header, with three big numbers: 42% of household waste recycled, 18 kg per household each month and 3,200 homes using new bins. A bar chart shows tonnes by material — paper and card is the largest at 540, highlighted in the accent colour — and four numbered tips tell residents what to do. The source line credits the council’s 2025 waste report. At 800 px wide the finished graphic is a comfortable length for a web page, and the PNG goes straight into a newsletter.
Design tips
- Use at most two main colours plus one accent.
- Keep text short: labels of a few words, steps under about 12 words.
- Round numbers sensibly (42%, not 41.87%) unless precision matters.
- Check colour contrast — light text on pale colours is hard to read.
- Add alt text when you post it online, summarising the key message and numbers.
- Always credit your data source.
Finding and checking data
- Use primary sources where possible: official statistics offices, published reports, your own records.
- Note the date of the data and the population it covers — “42% of households in the town in 2025” is clearer than “42%”.
- Check that percentages add up where they should, and that units are consistent.
- Avoid mixing data from different years or methods in one chart without saying so.
- Keep a copy of your source and calculations in case anyone asks.
Common infographic mistakes
| Mistake | Better approach |
|---|---|
| Too many numbers | Pick the three that support the headline |
| 3D or tilted charts | Flat charts are easier to read accurately |
| Pie with many slices | Sorted bar chart |
| Decorative fonts for body text | Plain sans-serif at a readable size |
| No source | Always add a source line |
| Text in images too small for phones | Test by viewing on a phone before posting |
Writing the headline
A good infographic headline states the finding, not just the topic. “Recycling in our town” describes a subject; “Our town now recycles 42% of household waste” tells the reader the main point before they read anything else. Keep it under about ten words so it stays large and readable, and use the subtitle for the date, place or scope of the data.
Accessibility
An infographic is an image, so screen reader users rely on alt text or an accompanying text version. Write a short alt text (the headline and the key numbers) and consider putting the full data in the page text or a table as well. The SVG download keeps text as real text, which some assistive technologies can read.
The infographic template pack
The optional pack includes a printable infographic planning worksheet, a data collection sheet, ten layout sketch templates (timeline, comparison, process, statistics, map-based and more), a colour palette card with accessible combinations and a checklist for publishing. The maker on this page is free.
AI-assisted content
This page was drafted with AI assistance and reviewed before publishing. Example figures are illustrative.
Frequently asked questions
How do I make an infographic for free?
Type your headline, stats, chart data and steps into the maker and download the PNG or SVG.
What size should an infographic be?
About 800 px wide for websites; 1080 px wide for social media.
How many statistics should an infographic have?
A few key numbers — three is a good maximum for the headline stats.
Should I use a pie chart?
Only for a few parts of a whole; bar charts are usually easier to read.
Can I edit the infographic later?
Yes — download the SVG and open it in a vector editor.
Is my content uploaded?
No. The infographic is built in your browser.
Can I use the infographic commercially?
Yes — you created the content; make sure you have the right to use the data and any logos you add.
How do I add alt text?
When posting, use the platform’s alt text field to summarise the headline and key numbers.